Introduction
This curriculum web is designed to help students explore sample data that they collect and guide them to making informal inferences about sample population means and standard deviations.
Top of Page
Curriculum Standards
MM2D1. Using sample data, students will make informal inferences about
population means and standard deviations.
a. Pose a question and collect sample data from at least two different
populations.
b. Understand and calculate the means and standard deviations of sets of data.
c. Use means and standard deviations to compare data sets.
d. Compare the means and standard deviations of random samples with the
corresponding population parameters, including those population parameters
for normal distributions. Observe that the different sample
means vary from one sample to the next. Observe that the distribution of the
sample means has less variability than the population distribution.
Top of Page
Aim
This curriculum web organizes important information about population mean, sample mean, population standard deviation, sample standard deviation, median, mode, range, and interquartile range, so students can discover and interpret meaning from statistical data. This curriculum web also aims to show students how to compare means and standard deviations of data sets. Students will be exposed to many ways of collecting data and organizing them graphically.
Top of Page
Rationale
In Math 2, Georgia high school students are required to explore statistical data that they have collected or that they may be interested in. Calculating the mean and standard deviation of data sets allows students to compare statistical data and acquire a deeper understanding of the differences in the data sets. Students can make inferences about the data sets and maybe understand the relationships among data and what may influence data. Everyday Americans are bombarded with statistics through their exposure to the media. Often times statistics are used to persuade an audience to think a particular way. Through this curriculum web students will be able to explore any statistical data that they find interesting and be able to make their own assumptions based on the comparisons of mean and standard deviation instead of mindlessly agreeing with the strong opinions of others.
Top of Page
General Goals
- Analyze the meaning of the mean, median, mode, range, IQR, standard deviation, and mean absolute deviation of your data.
- Search for quantitative data that interests the student
- Graph the data using one of the methods discussed in class
- Interpret results of the data collect based on the mean and standard deviation
- Compare and interpret data from more than one data set of a relative subject
Top of Page
Subject Matter Description
- Definitions of key vocabulary terms and how to perform calculations (population standard deviation, population mean, sample standard deviation, sample mean, median, mode, range, and interquartile range)
- Construction of graphical representations of the data (box plots, dot plots, histograms, and stem and leaf plots)
- Make conclusions based on interpretation of data
- Organize data using computerized spreadsheets
- Explain data using descriptive statistics techniques
- Cite sources of data
Top of Page
Learner Description
This curriculum web is designed for students in Georgia’s Math 2 curriculum that are being exposed to the statistics unit that relates to the following GPS.
MM2D1. Using sample data, students will make informal inferences about
population means and standard deviations.
Top of Page
Prerequisites
- Facility with web browser and Internet access
- Basic knowledge of order of operations
- Mastery of Math 1 statistics curriculum units
- Basic computer knowledge or skills
- Basic computer keyboarding
- Cooperative learning skills
Top of Page
Learning Objectives
On completing this curriculum web, learners will be able to:
- Construct two graphical representations appropriate for the data collected
- Calculate mean, median, mode, range, interquartile range, and standard deviation by any method of choosing (by hand, calculator, or computerized spreadsheet)
- Interpret results from calculations by using descriptive statistics
- Collect quantitative data
- Create display of results using basic computer word processor or graphic display programs like Glogster
Top of Page
Materials
- NBA scores worksheet
- Collecting class data worksheet
- Computer with Internet connection
- Definitions and explanation of key terms
- Notes over calculating mean, standard deviation, and interquartile range
- Examples of graphical representations
- Tutorial for using Google spreadsheet
- Web-based resources
- Rubric for student evaluation
- Tutorial for using Glogster for display
Top of Page
Instructional Plan
Day 1
Teachers should take at least 20 to 30 minutes to review statistical concept from the Math 1 curriculum. Use NBA worksheet for practice. Teachers should review the following skills: mean, median, mode, range, interquartile range, and mean absolute deviation
Show students how to calculate standard deviation by hand prior to starting the WebQuest (using the table method to organize the operations involved in calculating standard deviation may be helpful). Table Method Worksheet
Day 2
Review answers from the Day 1 worksheet where the students practiced calculating standard deviation using the table method.
Collect data for the data set worksheet. Complete each table with each students age, height, number of siblings, shoe size, number of pets, period, and number of text messages sent per week.
Allow students to begin calculating mode, median, mean, range, interquartile range, mean deviation, and standard deviation and completing the blanks from the class data.
Take 10 minutes at the end of class to show students how to input data into their Ti-84 or Ti-30XS multiview to easily calculate all of the descriptive statistics they have learned up to this point.
Day 3
The student will need access to the computer for this days activity.
The teacher should give an object to every 4th student that walks into your room. This is how the teacher will randomly select a sample to complete the final four tables in the data set worksheet from Day 2.
Ask the randomly selected students to give their data so the class can complete the final four tables on the data set worksheet.
The teacher should explain that the formula for calculating the standard deviation for a sample is different than the standard deviation for an entire population.
The teacher should have the students compare their results from the sample standard deviation to the results from the population standard deviation, calculated in Day 2. Have the students write a minimum of 5 sentences to compare the results of the population standard deviation and sample standard deviation in each data set and post it to Edmodo.
Day 4
The student will need access to the computer for this days activity.
Divide class in groups of two by pairing weaker students with those of stronger math ability. Introduce the WebQuest activity by having every student review the project rubric while the teacher explains requirements. Students can view it on their screens while the teacher projects one in the front of the class.
Introduce Glogs as a way for stuidents to produce their project on the computer without scissors and glue. Show them the tutorial video for Glogster and show them how to create an account.
Allow students time to search and explore possible topics that interest them.
Introduce the daily completion goals and explain that each group has to checkoff that they have completed the goals before leaving the class.
Accelerated students could create their own quantitative data collection surveys using Google forms and send them out to other students in school or post them to a Google site to collect student data.
Remind students to complete their daily goal checklist and submit it using Edmodo.
Day 5
Students will need access to the computer lab to work on their projects.
Allow students to work on their project using the online webquest as their guide.
Remind students to complete their daily goal checklist and submit it using Edmodo.
Day 6
Students will need access to the computer lab to work on their projects.
Allow students to work on their project using the online webquest as their guide.
Remind students to complete their daily goal checklist and submit it using Edmodo.
Remind students of their project due date.
Day 7
Students will need access to the computer lab to work on their projects.
Student groups will take turns showing their projects to the class.
Each individual student will submit the partner evaluation form.
Day 8(Final Day)
Students will need access to the computer lab to work on their projects.
Student groups will take turns showing their projects to the class.
Top of Page
Plans for Assessment and Evaluation
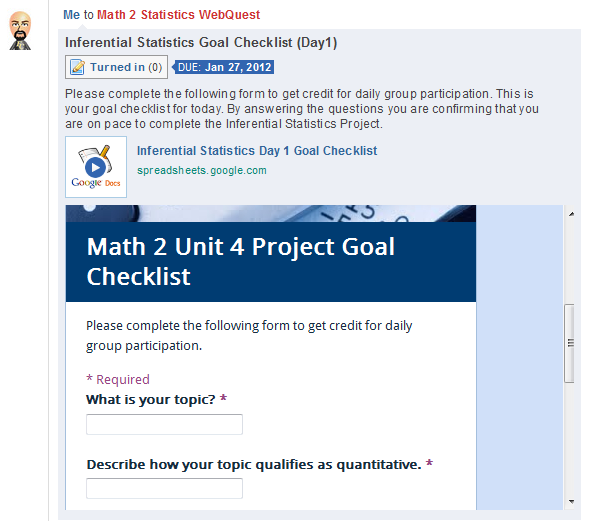
Daily Goal Checklist for Inferential Statistics Project
Daily Quiz/Checklist - Use group password f9kz8o for Edmodo and click on the assignment for that day's quiz/checklist.
Example:
Inferential Statistics Project Rubric will provide students a completion checklist to follow and it will serve as the grading criteria for the project.
Students will evaluate their partner by using submiting the Partner Evaluation Checklist provided in the Edmodo assignments tab.
Teachers can evaluate this curriculum web to help improve the usability of it among all types of leaners. Please take a moment to answer the questions in the brief evaluation below.
Top of Page
Contact Information
James Trask
Math 2 Statistics Curriculum Web
Top of Page
Curriculum Web Video Presentation
Here is a link to the video presentation that gives an overview of the curriculum web and it also gives visual details about navigation and website content.
Bibliography
|
Arcidiacono, G. (2009). Arithmetic mean calculator. Retrieved from www. Alcula. Com/calculators/statistics/meanw.
Rossman, A.J and Chance, B.L.(2011). Dot plot. Retrieved from www. Rossmanchance. Com/applets/dotplotapplet/dotplotapplet.htm.
Waner, S. and Costenoble, S. R.. (1999, April ). Histogram generator. Retrieved from Http://people. Hofstra. Edu/stefan_waner/stats/histogram. Html.
Borg, N.and O'hara, J. Initials. (2011, ). Edmodo. Retrieved from Http://www. Edmodo. Com/.
National football league. (2011, ). NFL players. Retrieved from Http://www. Nfl. Com/players? Playertype=historical.
MLB Advanced Media, L. P. (2011, ). Historical Player Stats. Retrieved from Http://mlb. mlb. com/stats/historical/player_stats. Jsp? Tcid=mm_mlb_stats.
Top of Page |
|